



Go behind the scenes and see our job openings on Welcome to the Jungle.
Welcome to the JungleAbonnez-vous à WizTips, notre newsletter.
S'abonner à WizTipsWizville brings together visitor feedback, public reviews and competitor benchmark to help your teams improve the experience, manage your assets and strengthen their appeal.
Property companies that manage the experience of their destinations with Wizville
Each asset type attracts visitors with different expectations. The measurement base stays the same, but the questions, touchpoints and priority themes adapt. Select your asset type.
A long, often family visit, where the destination is judged as a whole: access, parking, wayfinding in a large space, dining, leisure, events and comfort. The number of retailers makes reading by theme essential — a single score says nothing actionable at this scale.
Short, repeated, often weekly visits where efficiency comes first: find a space, do the shopping, leave. Loyalty is won on consistent operational details, and the local listing carries real weight because the customers live nearby.
An outdoor format where the experience depends heavily on the open air: clarity of traffic flow, parking close to the store, weather, shelter, clean roadways and directional signage. The challenge is to measure a place with no mall — the overall perception is built between the buildings.
An intentional, longer, sometimes touristic visit, where expectations focus on the perceived value of the offer and the pleasure of wandering. Visitors come from far away: information before the visit, services and the quality of the welcome matter as much as the discounts.
Stations, multimodal hubs and places people pass through: the visitor is in a hurry, bound by a timetable, and pain points are measured in minutes. The retail experience is judged against the time available — immediate wayfinding, speed, cleanliness and perceived safety come before discovery.
Merging the experience of the centre with that of the retailers hides the causes. Separating them makes overall appeal impossible to understand. The programme therefore keeps three readings: centre, retailers and combined experience.
Did access, parking, wayfinding, cleanliness, comfort, welcome and services live up to your visit?
Handle the pain point that falls to your teams: extra cleaning in an identified time slot, temporary signage during works, faulty equipment replaced, information better relayed at the welcome desk.
Does the offer match what you came for — retailers, dining, leisure, services?
Feed performance reviews and tenant mix discussions with a contextualised reading: the retailer's sector, review volume and recency, local context, specific themes, change over time and actions already under way. Bring objectivity to a dialogue, never publish a tenant league table.
Will you come back here rather than elsewhere, and what would decide that choice?
Link the two previous readings to the stated preference, then compare the result with destinations in the same catchment area to see whether the gap is widening or narrowing.
The journey starts online and continues after the visit. Measuring it step by step shows where the experience broke down, unlike an overall score.
Local information that is missing, wrong or out of date: opening hours, services, shops, events or reviews.
Local information, ratings, recent reviews and replies: the first impression is managed centre by centre, not as a portfolio average.
Congested access, poorly signposted public transport or works not communicated.
Perceived ease of access varies by mode of transport, day and time.
A space hard to find, unclear signage, a payment that fails or a congested exit.
Flow at entrance and exit, clarity of rates and payment, areas named in the verbatims: the car park opens and closes the experience.
Insufficient signage, an unreadable map, a store searched for and not found, a welcome desk that cannot be found or is unstaffed.
Ease of wayfinding, clarity of maps and quality of the welcome are measured separately, because they call for different actions.
A disappointing offer, a closed shop, too many people or too much noise, insufficient cleanliness.
Perception of the variety of the offer, the quality of the retailers, the comfort and cleanliness of common areas.
Too long a wait, no seat available, an expensive or limited offer, a poorly signposted event.
Dining, leisure and events are measured separately: a centre can satisfy in its mall and disappoint at lunchtime.
Poorly maintained restrooms, an unavailable seating area, a digital service or a lift out of order, insufficient accessibility.
Availability and condition of restrooms, seating areas, lockers and digital services, as well as accessibility and perceived safety, particularly in the evening.
A difficult exit or a wait in the car park can wipe out the whole visit.
Final satisfaction and intention to return are analysed by reason for visiting, because a quick errand and a leisure afternoon do not carry the same expectations.
A complaint with no follow-up, a review with no reply or an incident discovered online.
Detection, assignment, time to take charge, effort required and closure: handling dissatisfaction becomes an indicator in its own right.
Five stages linking a pain point, its frequency, the assets concerned, the action decided and how the result evolves.
Each asset has its own catchment area: the perimeter is set by town, metropolitan area, travel time or a chosen list of destinations.
At portfolio level, comparison is made only between assets of comparable type and context: a regional centre, a neighbourhood centre and a transit hub do not go into a single ranking.
Your assets compare less with each other than with the alternatives available to visitors.
The benchmark identifies gaps and good practices between comparable perimeters, including over time. It produces neither a public ranking nor a measure of footfall or asset value.
The perimeter is defined asset by asset, by town, metropolitan area, travel time or a chosen list, and can include other types of destination.
Being the best-perceived destination is not enough. You need to understand where competitors are improving and why they are chosen: offer, accessibility or experience.
Beyond the score, measure whether your decisions really strengthen your position against local alternatives, at comparable season and perimeter.
One asset's performance sheds light on the others. The benchmark feeds both local diagnosis and portfolio management.
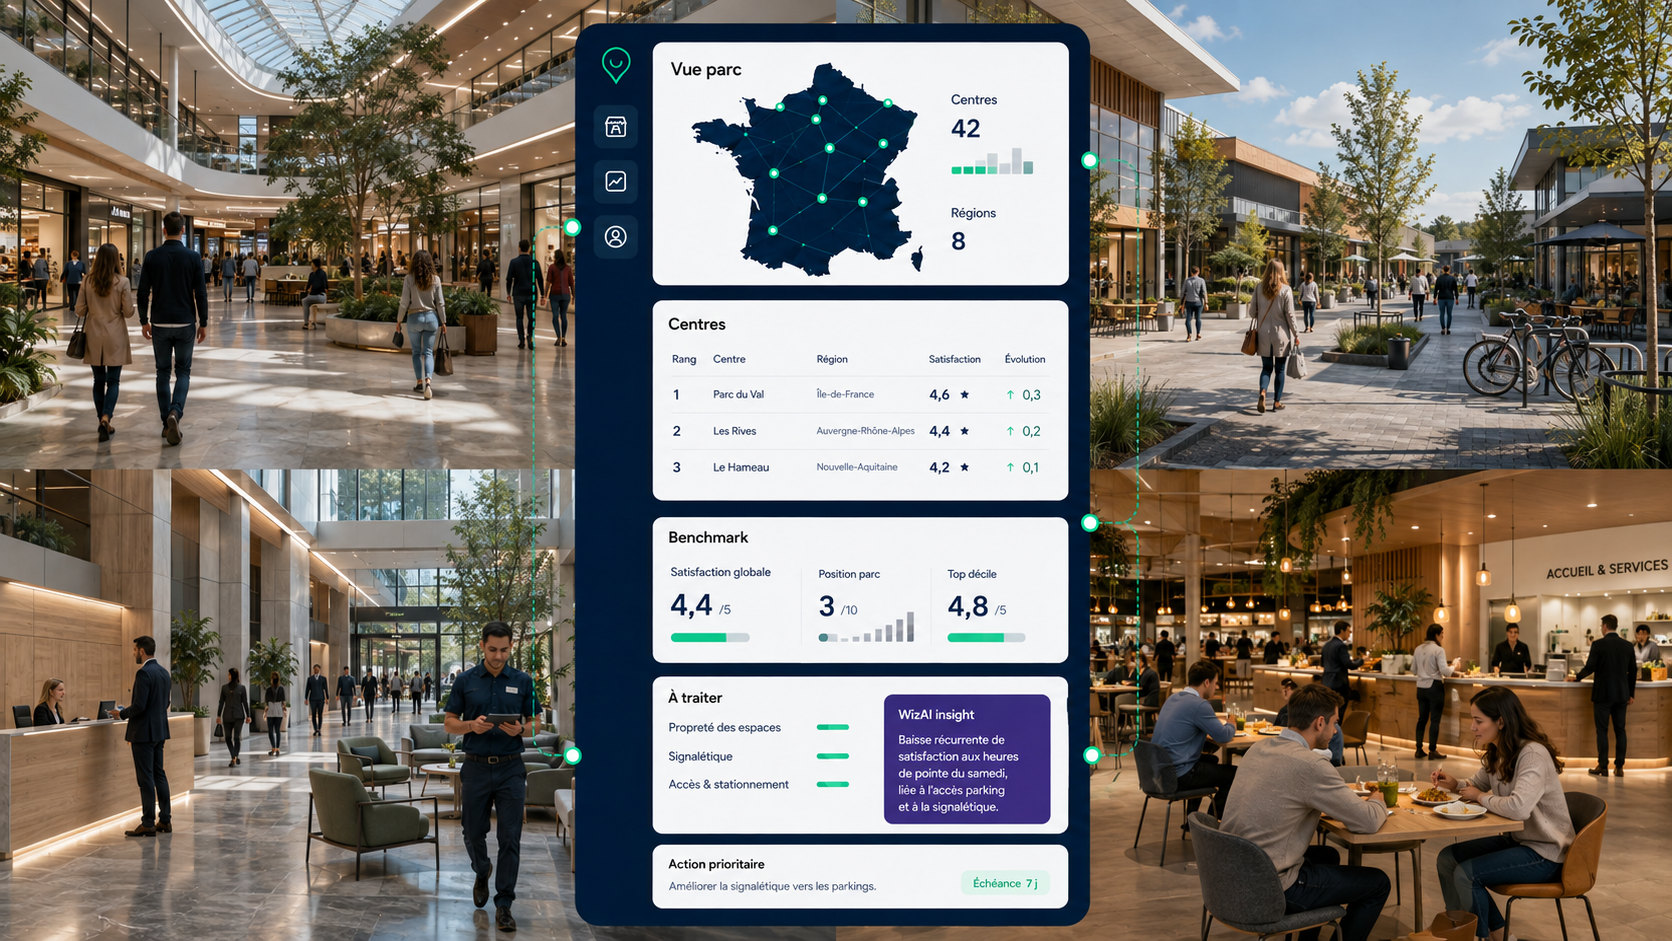
Comparison of a centre with the destinations in its catchment area, theme by theme. Illustrative example: the topics, perimeter and competitors tracked are defined with you.
The area does better on parking and wayfinding, two topics your teams can act on directly: directional signage, information, turnover and signage.
Dining, welcome and comfort are the destination's strengths. These assets should feed local communication, the dialogue with retailers and the sharing of good practices across the portfolio.
The programme is structured by country, region, asset type, centre and role. Each level receives a suitable view, rights and actions — the exact scope of access, alerts and integrations is defined during deployment.
Some pain points are fixed immediately, others require a procedure, an investment or a repositioning. What matters is linking each pain point to its frequency, the assets concerned, the actions taken and the results.
Operations, cleanliness, welcome, equipment
A specific, located and dated dissatisfaction — a restroom, a car park level, a lift, a queue.
A pain point everyone notices and nobody owns: it comes back every week without ever becoming a case.
An alert routed to the right owner, with an expected time frame and a documented closure. Handling is measured as an indicator, not as an intention.
Events, service, opening hours, routes, training
A theme recurring over several weeks, concentrated on a time slot, an area or a reason for visiting.
Event decisions taken on intuition, without knowing what they fix or how to check that they helped.
The frequency of a theme, its location and how it evolves after the action — the before/after becomes proof rather than an impression.
Parking, restrooms, renovation, dining, accessibility
A persistent, widely shared pain point, and a lasting gap with the destinations in the area on the same theme.
An investment decision defended without proof of use: the best-presented project comes before the one most useful to visitors.
The frequency and age of a pain point, the assets concerned, the competitive gap by theme, then the measured effect after delivery — at comparable season.
Positioning, tenant mix, role of the asset
A shift in destination preference: visitors say why they choose — or would choose — somewhere else.
A strategy built on footfall alone, without knowing what visitors come for and what would bring them back.
Perception of the offer and the place, stated preference and relative position in the area — a light on perception, never a measure of footfall or asset value.
The local action plan is what stops measurement from remaining a report. It gives each pain point an owner — centre team, contractor, support department, region — a deadline, and a check on the effect achieved.
A pain point without an owner comes back indefinitely. Assignment follows your real organisation, operations contractors included.
After the action, the theme is tracked on the same population and at comparable season. It is the only way to know whether the problem has been solved or merely moved.
The centre sees its plan, the region sees progress across its assets, head office sees what is systemic. The same data, three uses.
A centre's listing mixes reviews about the car park, the shops, the crowds, cleanliness, dining, safety and events. Brought together and sorted by theme, these reviews become an operational resource; left as an average, they only serve to take note.
Invitations to post a review remain neutral and are sent to eligible visitors under a common rule: no selection based on satisfaction, no incentive, no review removal.
Reviews from the whole portfolio, attached to the right asset and the right themes, across the platforms and countries actually covered by the programme.
The same 3/5 can be about the car park, a retailer or the noise. Sorting by theme brings out the recurring signals that the average rating hides.
Who replies, within what time, in what tone, and which cases go through a review: the framework is set at group level, the reply stays local and in context.
Four indicators tracked per asset, then compared with destinations in the same area: this is what a visitor hesitating between two places actually sees.
A good reply acknowledges the feedback, stays measured and specific to the theme raised, then invites the conversation to continue in private. A draft written in the brand's tone saves centre teams time; it does not replace them.
A public reply never discloses information about a security incident, about a person — visitor, employee, agent — or about a retailer. No reply is published automatically: approval stays human.
What falls to the centre is handled by the centre; what falls to a retailer is passed on to the retailer without naming them publicly.
An incident, a complaint or a sensitive situation is handled on a private channel, with an owner, an action and a closure — never on the public listing.
The best workflow links the review to an action on the ground. Handling status is tracked as an indicator in its own right, alongside the response rate.
Klépierre uses Wizville to analyse over 800,000 reviews a year, compare its centres within their catchment area and feed action plans in the short and long term. The programme described in the customer story includes personalised questionnaires, a benchmark of each centre against the competitors in its area, analysis of how the retailers present are perceived, identification of the reasons for satisfaction and dissatisfaction, operational action plans as well as structural investments, and AI-generated replies to reviews. Figures and scope as presented in the Wizville customer story: they describe a specific programme and are not a guarantee of results for another portfolio.
« The customer experience must be flawless, experiential and enriching. Thanks to Wizville, we can collect our customers' reviews and better understand their expectations, so as to offer them the best possible experience in our centres. »
By moving away from a single satisfaction question in favour of measurement at each step of the visit. A visitor's journey starts online — opening hours, access, services, events, recent reviews — then continues with access, parking, entering and finding the way, visiting the spaces and the stores, dining and leisure, using the services, leaving, and finally the review or complaint after the visit. Personalised, multi-experience questionnaires are triggered at the touchpoints that matter, in a format suited to the reason for visiting and the time available. Verbatims are then analysed by theme — parking, cleanliness, restrooms, welcome, signage, comfort, perceived safety, accessibility, offer, dining, incident handling — so that each pain point becomes actionable for a team. Wizville measures perception from the sources covered: it does not assess footfall, revenue or asset value.
By defining the comparison perimeter asset by asset, rather than comparing the centres of the same group with each other. A centre competes with the shopping centres, retail parks, high streets, leisure areas and digital destinations actually accessible to its visitors: the perimeter is therefore set by town, metropolitan area, travel time or a chosen list of destinations. The comparison is then made theme by theme, not on an overall score: remaining the best-perceived destination locally does not tell you on which topic a competitor is improving, nor why it is chosen — for its offer, its accessibility or its experience. Two rules frame the exercise: compare like-for-like perimeters, and compare at comparable season, peak to peak. The benchmark is used to identify gaps and inspiring practices; it does not produce a public ranking.
By keeping two distinct readings, brought together by a third. The first covers the experience of the place — access, parking, wayfinding, cleanliness, comfort, welcome, services, perceived safety — that is, what your teams and contractors manage directly. The second covers perception of the offer: variety and relevance of the mix, quality of the stores visited, dining and leisure. The third measures destination preference, which depends on both. Merging these levels into a single score hides the causes; separating them completely makes preference impossible to understand. On the retailer side, the reading stays in context — the retailer's sector, review volume and recency, local context, specific themes, change over time, actions already under way — because the aim is to co-build improvements with retailers, never to publish a tenant league table.
Going further
The Wizville use cases retail property companies rely on.
Find out how Wizville adapts listening, analysis, benchmark and action plans to your portfolio and your asset types.
Demo tailored to your asset types, your countries and your organisation.