




Product

Sales impact

Measure, in euros and store by store, what customer satisfaction brings to your sales. For the first time that impact is shown at store level, in simple figures your field teams can act on straight away.

What it changes
across our customers · last 12 months
Measured on checkout data
Annual spend per customer
+30%
Average basket +25% on every purchase
Visits +15% per year
Reviews collected
Sites
Annual spend Average basket Visits By topic
Why it matters

Measure precisely how satisfaction drives your sales

Analyse the effect of satisfaction on average basket, repeat purchase and cumulative spend, in euros and on your own real data. The calculation runs automatically and in real time as soon as transactional data is available, store by store and no longer at network level only.

  • Plug-and-play
    Calculated automatically and in real time as soon as your transactional data is available. No complex set-up, no waiting.
  • Transparent algorithm
    Verifiable, explainable calculations that your teams understand and take ownership of, without second-guessing them.
  • Reliable even on small scopes
    When a store does not yet have enough reviews for a reliable local calculation, the agent falls back on network data rather than showing an approximate or misleading figure.
  • Configurable
    A tool that adapts to your organisation, from a simplified mode for the field to an expert mode for head office, with fully configurable settings (€/% unit, reliability threshold).
Cumulative spend per customer In-store post-purchase
Promoter 154 €
Detractor 108 €
+46 € more in cumulative spend over the last 12 months.
Measured on your transactions, illustrative example
How it works

Predictive recommendations, not just a figure

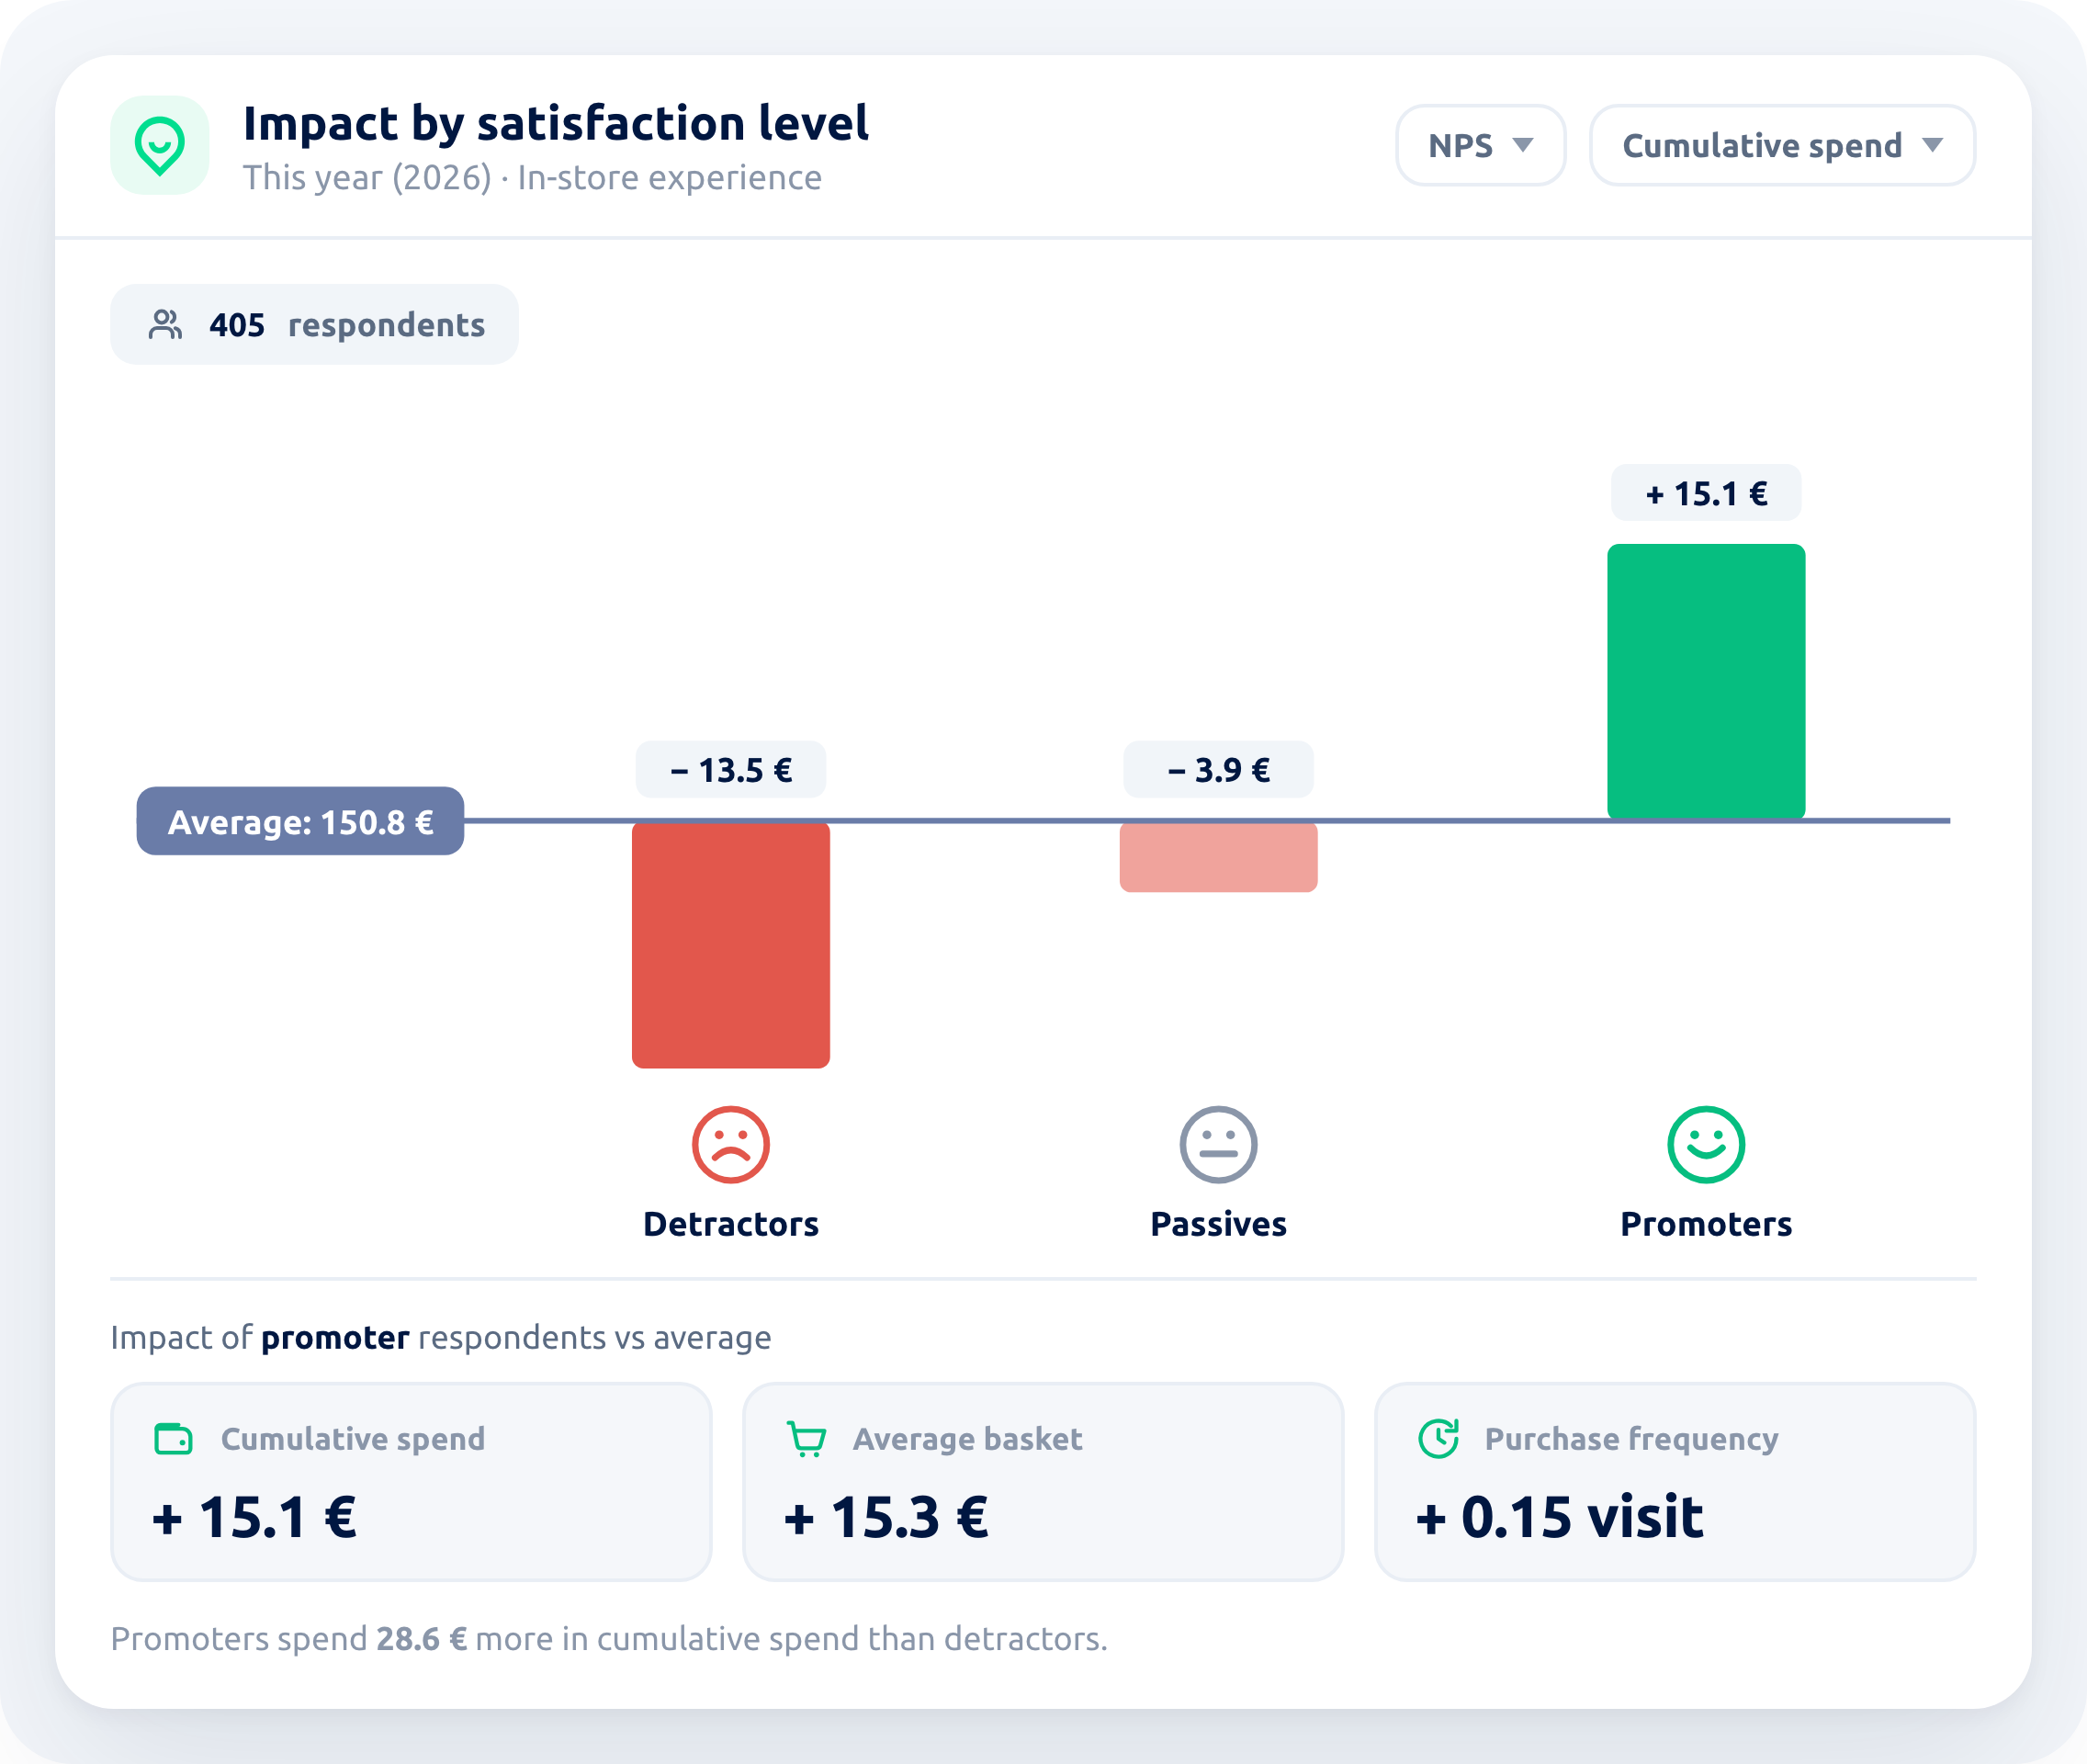
Wizville screen: spend of detractors, passives and promoters compared with the 150.8 € average, and the impact of promoters on cumulative spend, average basket and purchase frequency
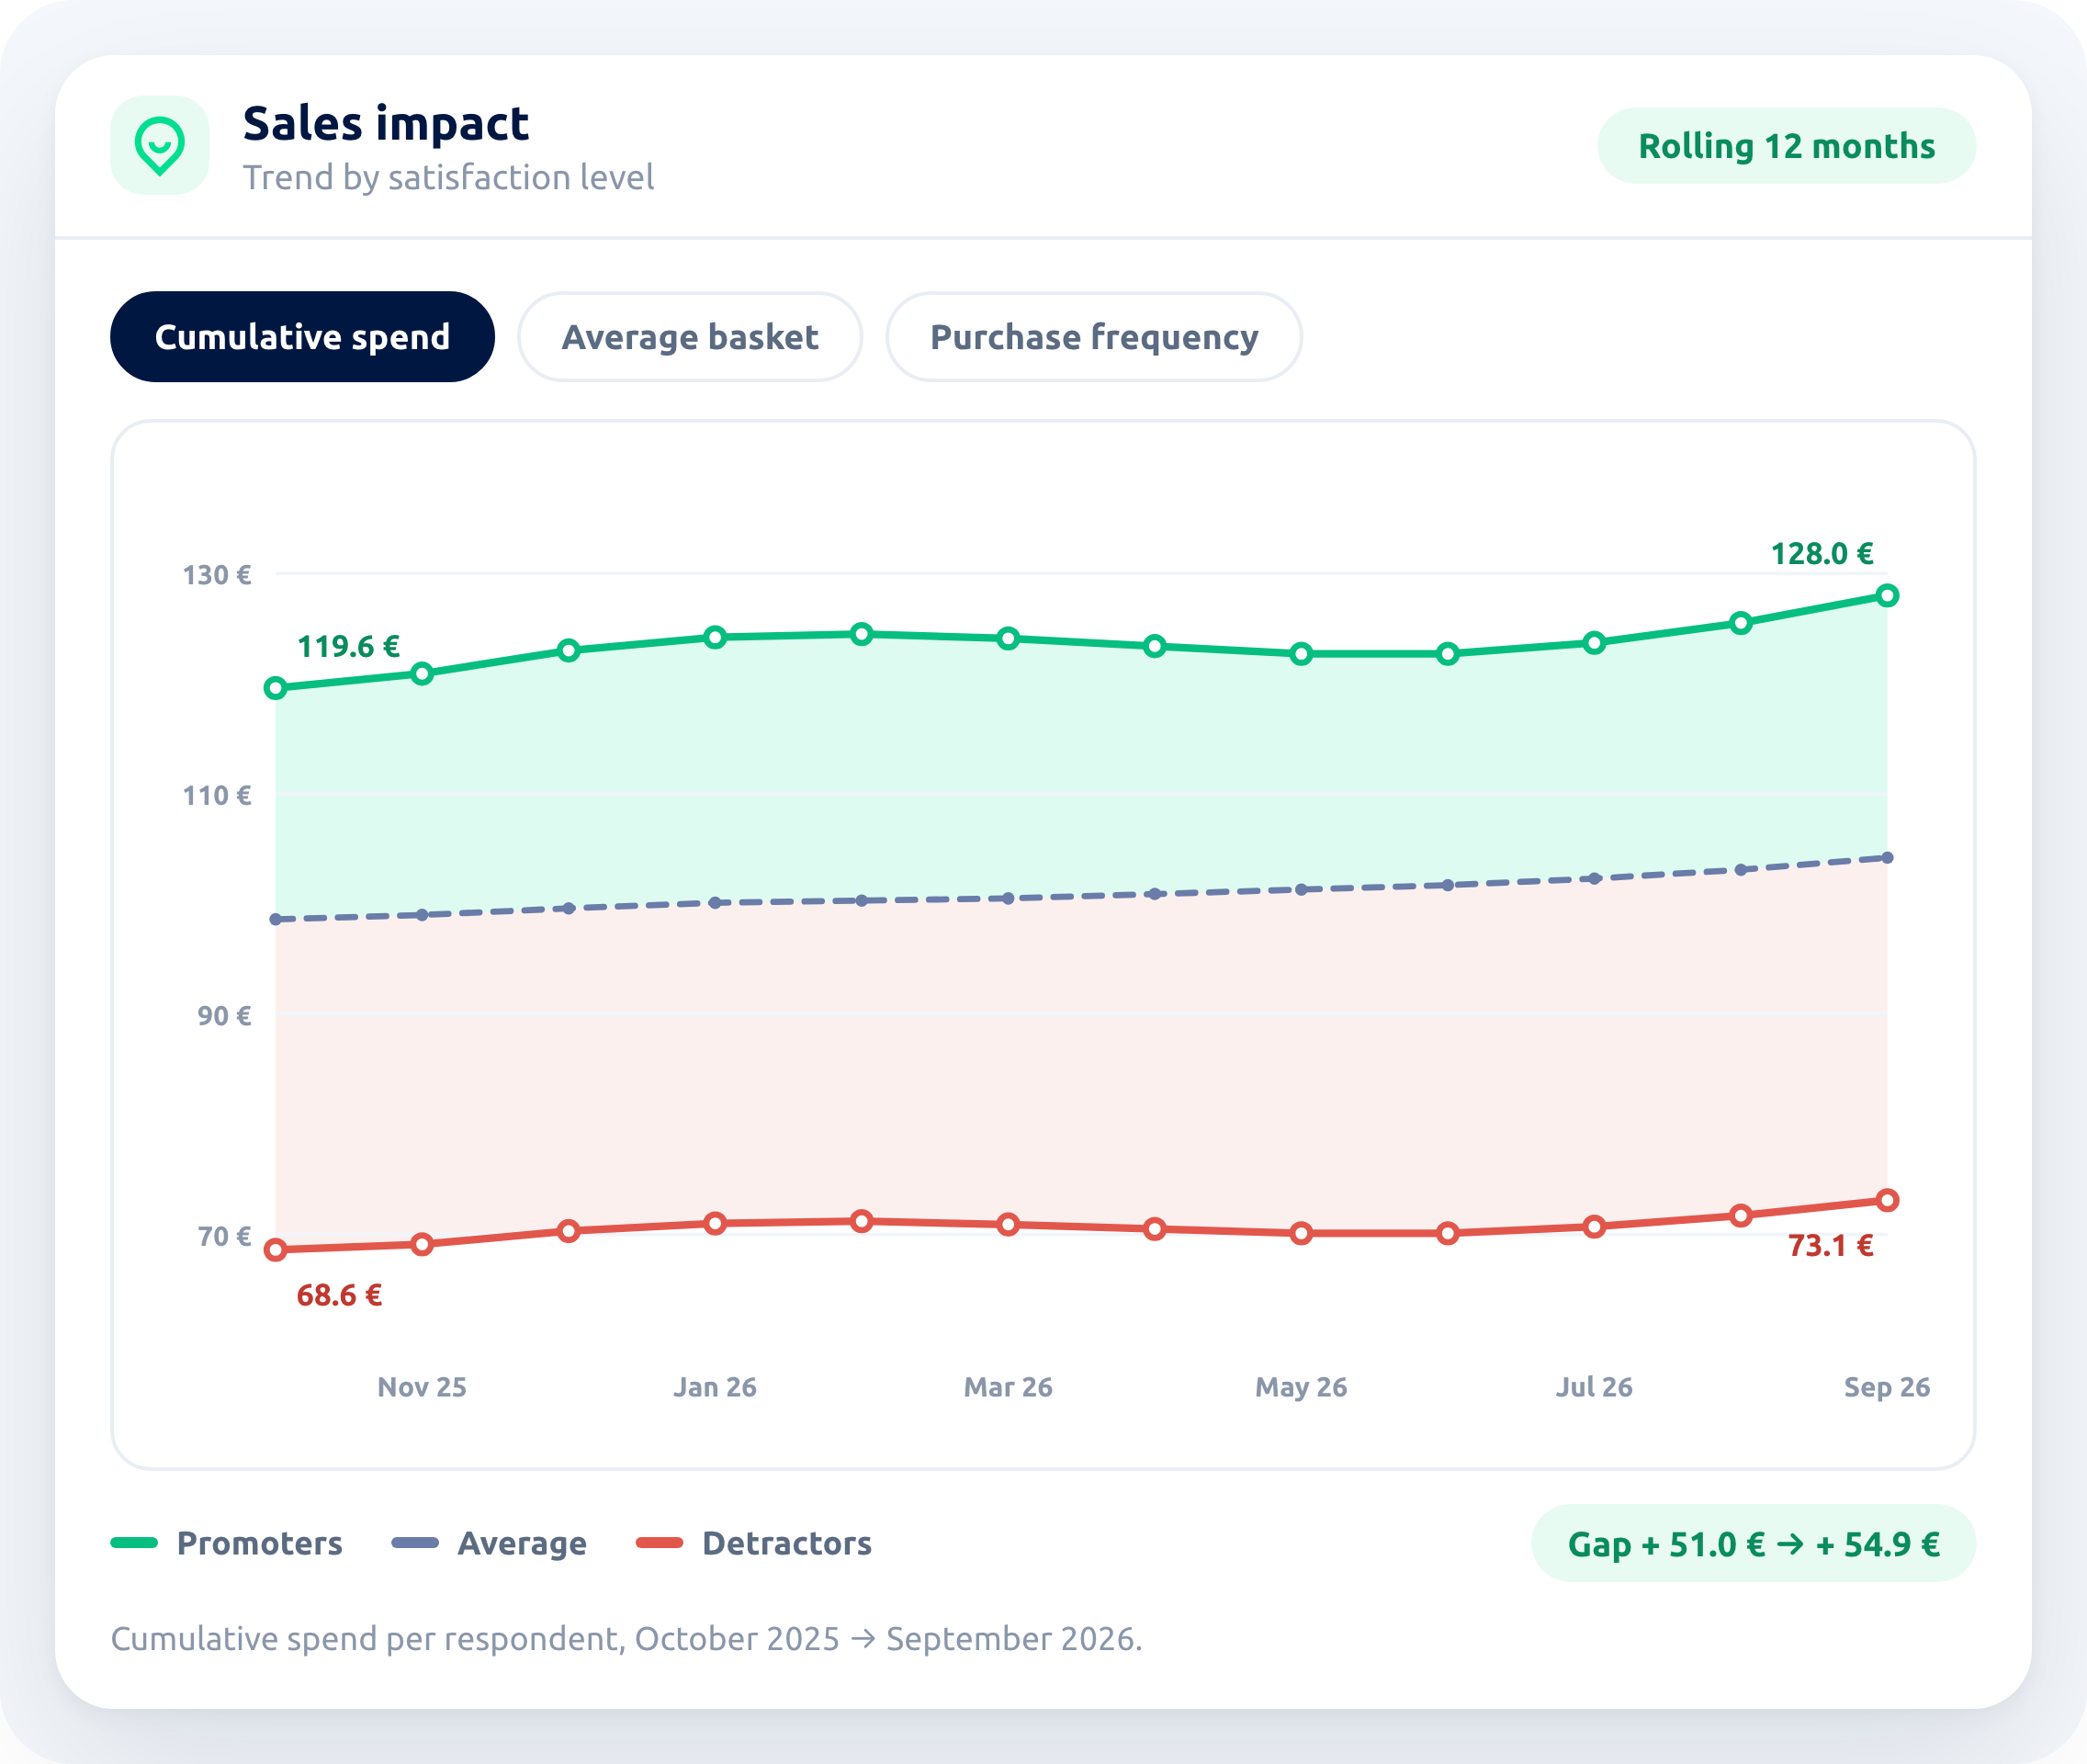
Wizville screen: 12-month curve of cumulative spend for promoters, the average and detractors
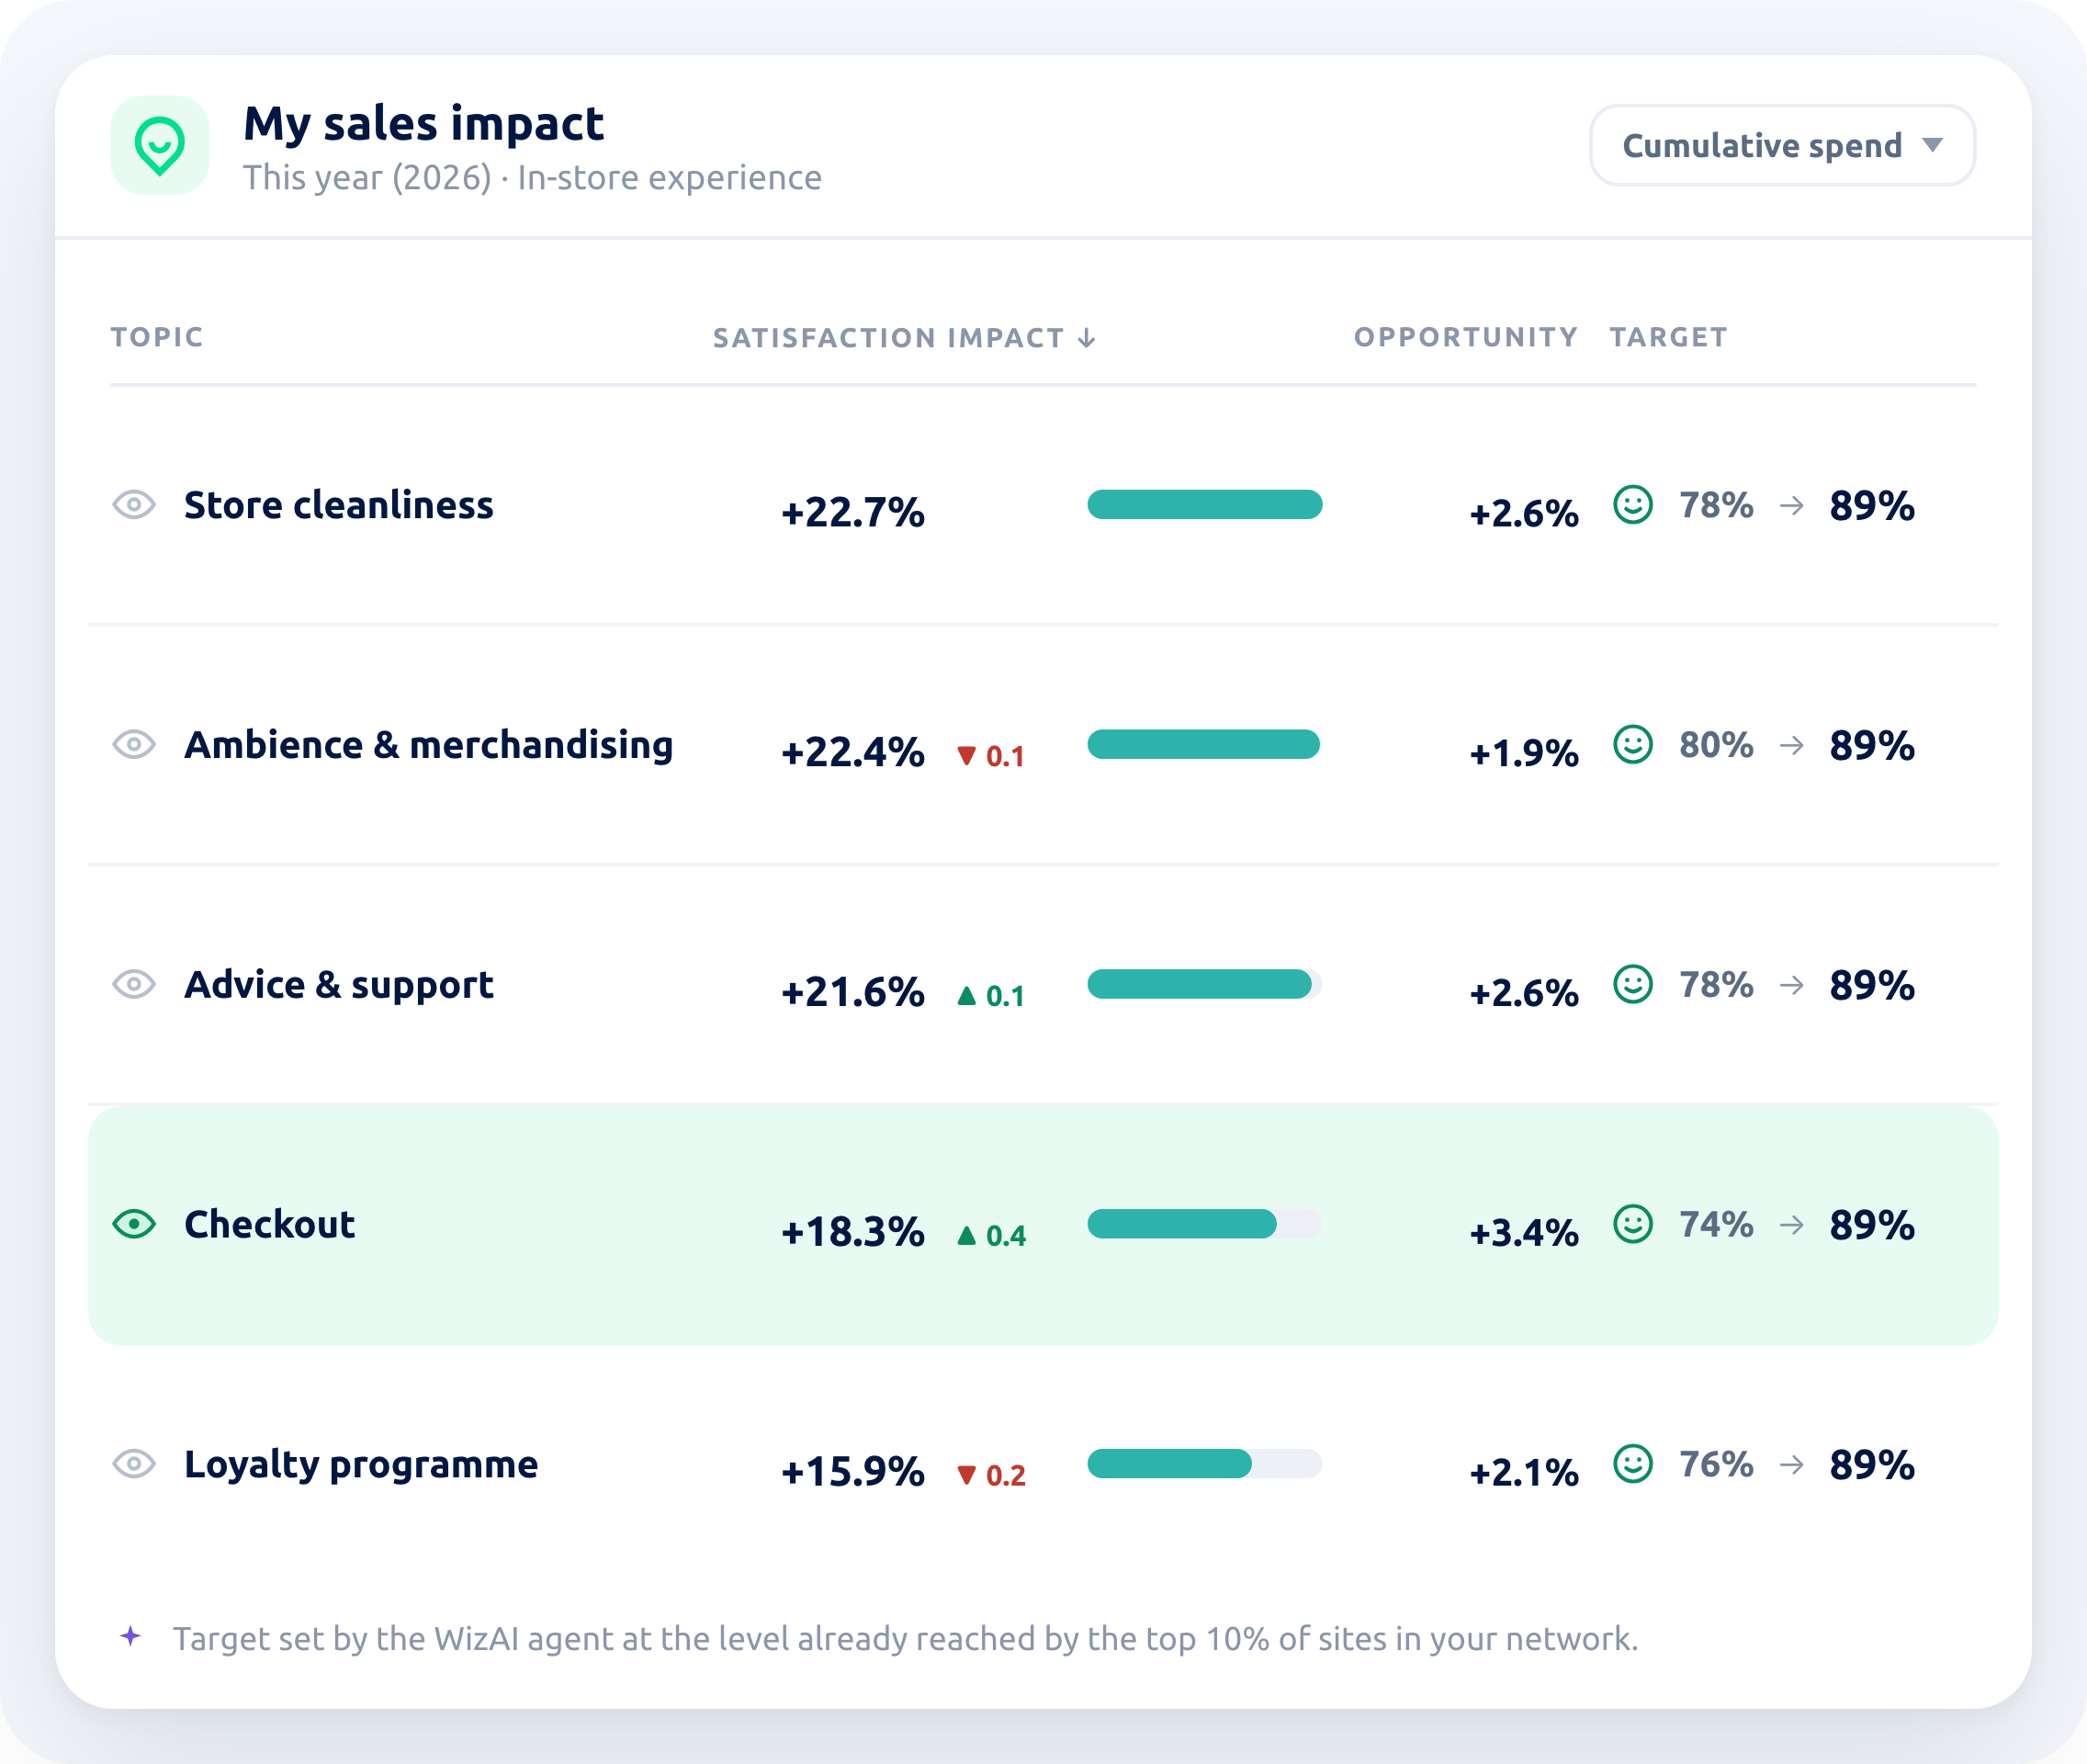
Wizville screen: table of topics with their impact on sales, the remaining opportunity and the target to reach, from 74% to 89%
01

The revenue to be gained, topic by topic

Quantify in euros what every point of satisfaction gained brings to your organisation, and identify the levers to pull first: Advice, Welcome, Store atmosphere, Loyalty programme.

02

The trend over time, not just a snapshot

Track average basket, repeat purchase and cumulative spend by satisfaction level, month after month, to check that your actions are paying off.

03

Targets modelled on your best stores

The agent sets concrete, reachable targets based on the performance of the most advanced sites in your network.

Demo · 30 minutes

See what it looks like on your own figures

A Wizville expert plugs the Sales impact module into your sector and your sites, and shows you the promoter-versus-detractor gap on your own data.

Request a demo

What it changes for your organisation

The impact of customer satisfaction on sales turns a metric that is often misunderstood into a concrete performance lever, for every store, every region, every department.

No more missing or unreadable data

The agent guarantees reliable figures at every level, drawing on network data whenever local data is not sufficient.

Prioritise the topics with the highest ROI

The agent identifies the levers with the greatest effect on average basket, repeat purchase and cumulative spend.

Engage your teams at every level

Figures in euros that everyone understands, with local data specific to each store.

Drive lasting growth

By acting on the right satisfaction levers, improve average basket and repeat purchase, store by store.

What our customers say

ChatGPT Image 23 juil. 2026, 18_41_05 (2)

“Wizville isn't just a tool. There is a whole team behind it, and support from customer satisfaction experts, which allows us to achieve excellent results.”

Delphine Audibert
Chief Digital Officer, Jacadi
What they say

They already manage their customer satisfaction with Wizville

Jardiland Louis Pion Naturalia Etam
FAQ

Frequently asked questions

Your post-purchase satisfaction responses are matched with your actual transactions. Wizville then compares the buying behaviour of promoters, of the average customer and of detractors: cumulative spend, average basket and return frequency.

The transactional feed that already triggers your post-purchase surveys, with the transaction amount. No further development is needed once that feed is in place.

Below the statistical reliability threshold, network data automatically completes the calculation. It stays identified as such and is never confused with the site's own performance.

No. The calculation starts automatically as soon as your transactional data is available. What remains configurable is the unit displayed (€ or %) and the reliability threshold, from a simplified mode for the field to an expert mode for head office.

Each person within their own scope: a consolidated view for head office, an area view for regional managers, a site view for store managers. Access is managed user by user.

See what the future of customer satisfaction management can do for your business

Talk to a Wizville expert now and find out how our platform answers your challenges.

Request a demo